Top Year 13 Achievers 2022
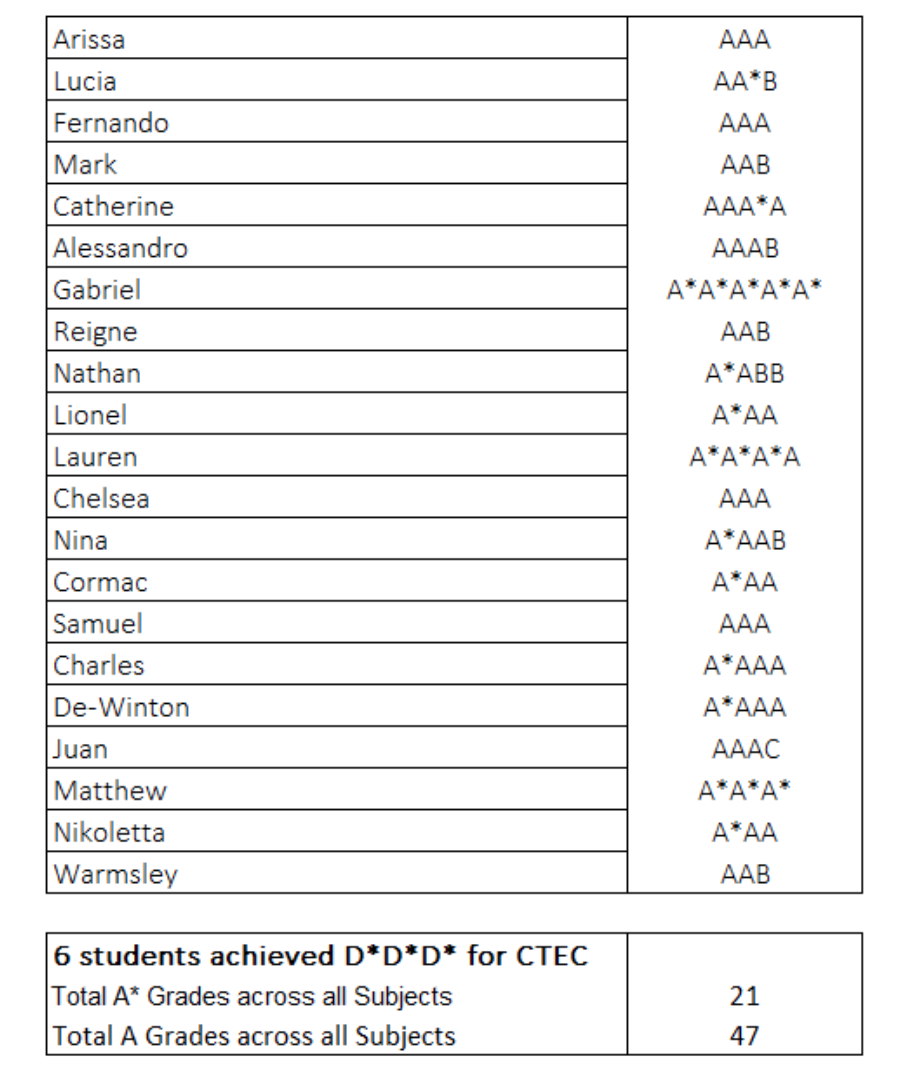
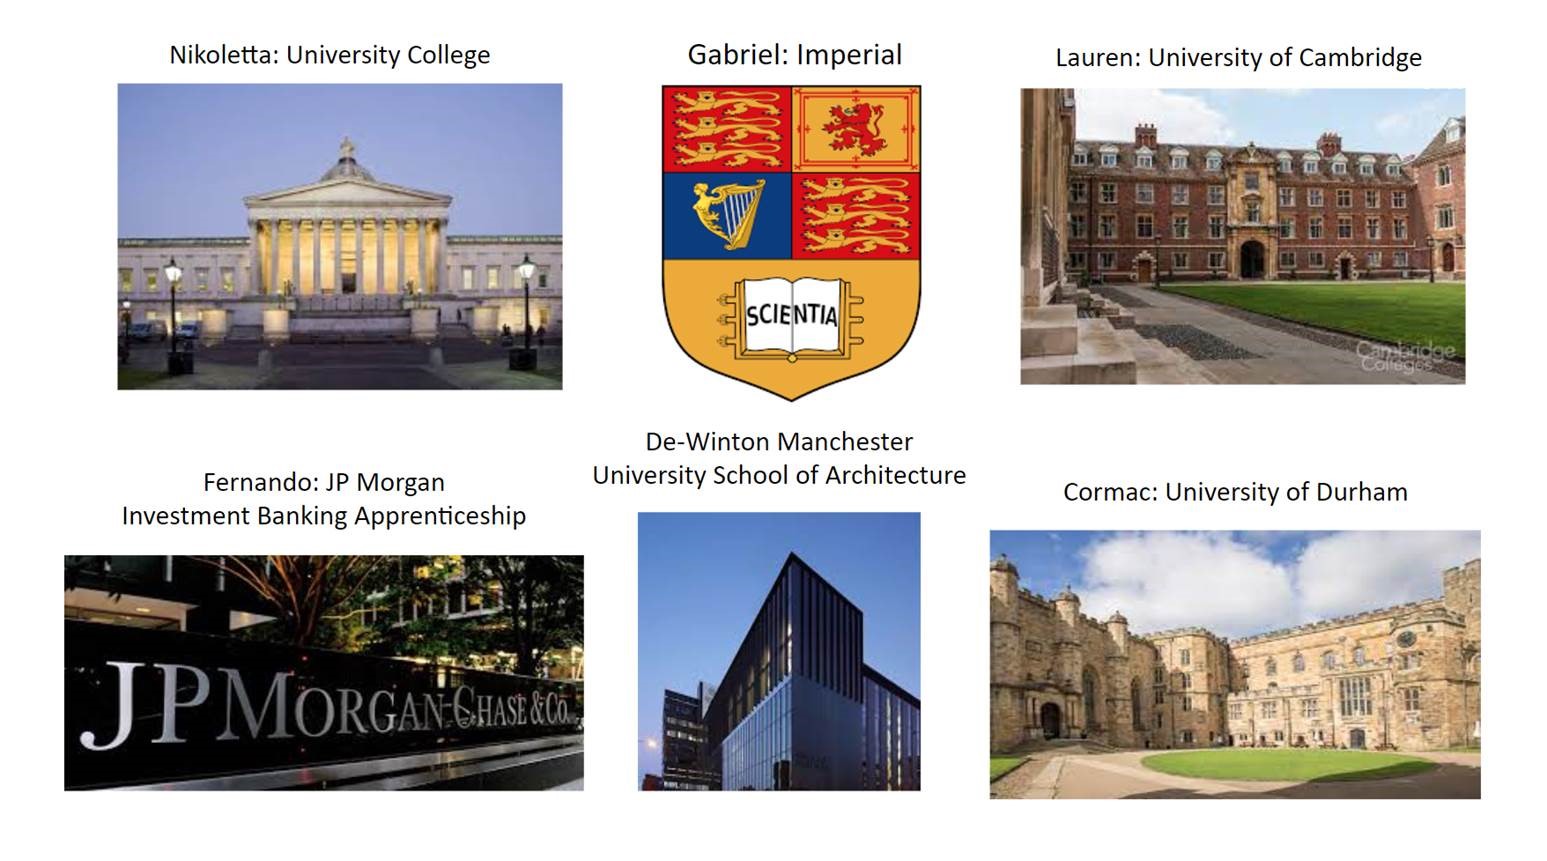
St. Michael’s sixth form achieved best ever results in Summer 2022. As a result students were able to progress to top destinations, including Cambridge, Imperial and Durham. Lauren with A*A*A*A met the conditions for her offer from St. Catherine’s, Cambridge to study Veterinary Medicine; Gabriel, top performer for 2022 with A*A*A*A*A* met the conditions for his dream course of Computer Science at Imperial; Matt with A*A*A* was accepted by Southampton to Study Biochemistry; De-Winton- Architecture at Manchester; Nikoletta- Media and Film at UCL; Charles- Economics at Bristol; Nina- Psychology at King’s; Fernando a prestigious Investment Banking Apprenticeship at J.P. Morgan- the list goes on… The Honours Pathway results are indicated on the table below.
Over 95% of all St. Michael’s students achieved a university or apprenticeship place, with almost half of all university places being at Russell Group universities.